

The popularity of a repository is another crucial indicator of the health of a project. It signifies interest from both developers and users alike, pointing towards viability and continued development.
Between each layer, there are weights that determine the impact of any given feature on a practice, and of any given practice on the metric. You can find the data model illustrated below:
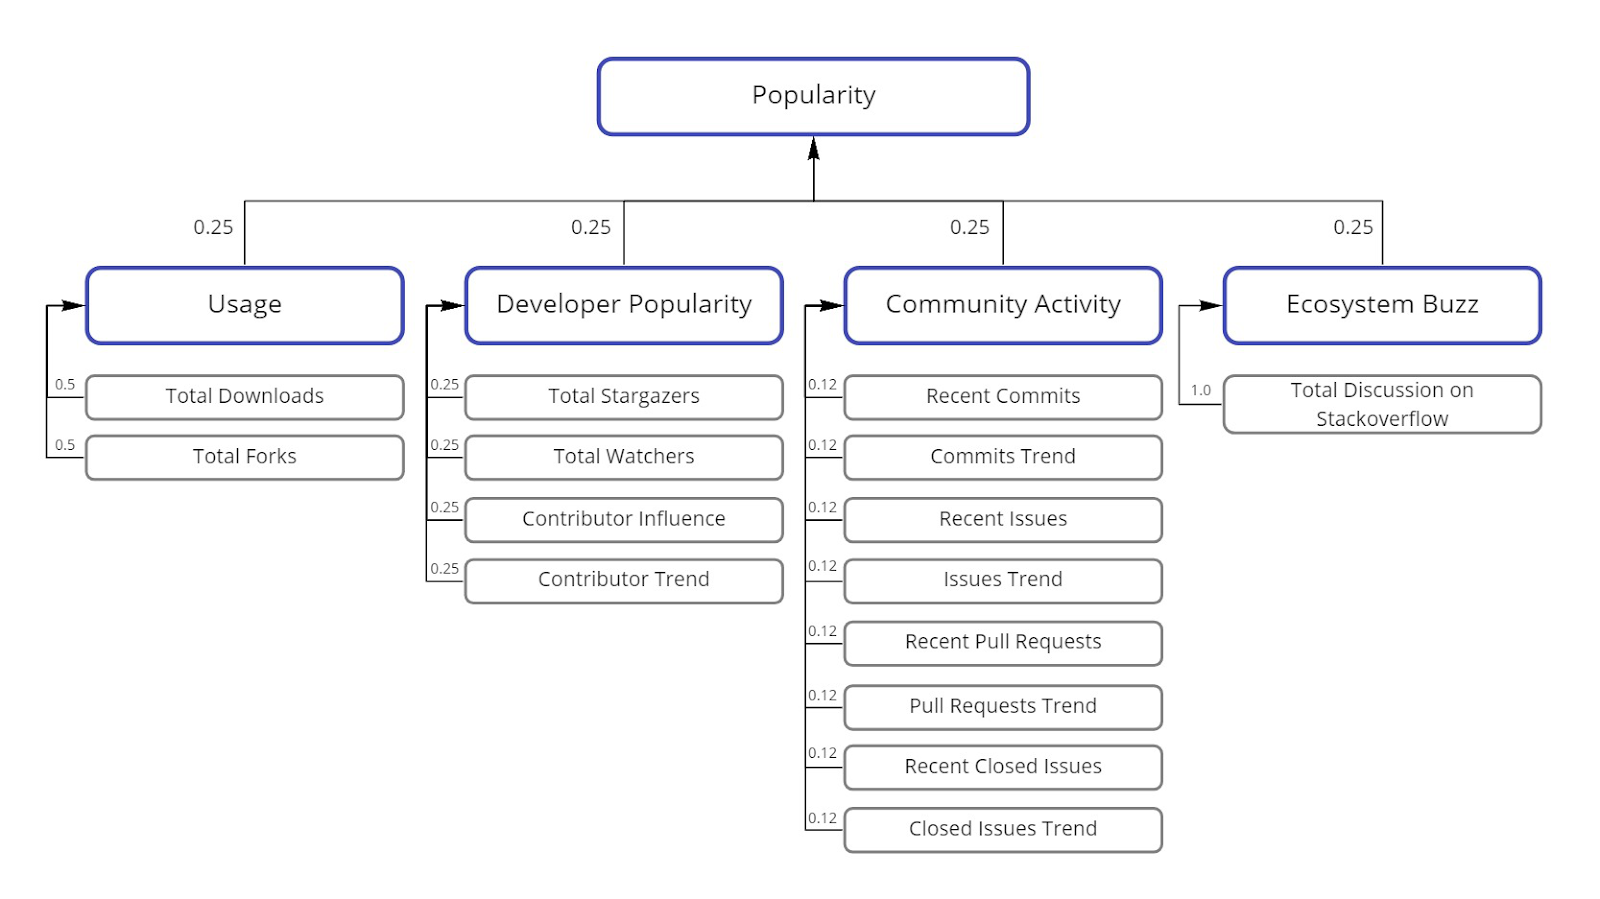
Usage
This practice describes the usage of a repository among open source users.
The following features of Usage are measured:
-
Total Downloads: the total number of times a repository has been downloaded through its respective package manager
-
Total Forks: the total number of times a repository has been forked
Developer Popularity
This practice describes how popular the repository is among the developers. More popular repositories attract more and more skilled developers to contribute.
The following features of Developer Popularity are measured:
-
Total Stargazers: the total number the repository has been “starred” in GitHub
-
Total Watchers: the total number of users watching this repository in GitHub. Watchers are notified about activity on the chosen repository
-
Contributor Influence: how much attention the contributors attract to the repository
-
Contributor Trend: the change in contributors, averaged over 10 weeks
Community Activity
This practice describes how active the community of a repository is. In this case, “community” entails both contributors and users. The activity is measured with features that analyze the current volume of commits, issue, and pull requests, as well as the trend of said volume.
The following features of Community Activity are measured:
-
Recent Commits: how many new commits have been made to the master branch within the last 10 weeks
-
Commits Trend: the linear change in commits per week for the past 21 weeks (whether it is increasing or decreasing)
-
Recent Issues: how many new issues has been posted within the last 10 weeks
-
Issues Trend: the linear change in posted issues per week for the past 21 weeks (whether it is increasing or decreasing)
-
Recent Pull Requests: how many new pull requests have been made within the last 10 weeks
-
Pull Requests Trend: the linear change in pull requests per week for the past 21 weeks (whether it is increasing or decreasing)
-
Recently Closed Issues: how many issues have been closed within the past 10 weeks
-
Closed Issues Trend: the linear change in closed issues per week for the past 21 weeks (whether it is increasing or decreasing)
Ecosystem Buzz
This practice describes the buzz of a particular open source project in different parts of the ecosystem. A higher buzz implies better support from platforms such as Stackoverflow.
The following feature of Ecosystem Buzz is measured:
-
Total Discussions on Stackoverflow: the total number of search hits a repository/package has on Stackoverflow
Exploring the Debricked Health Metrics - video guide