

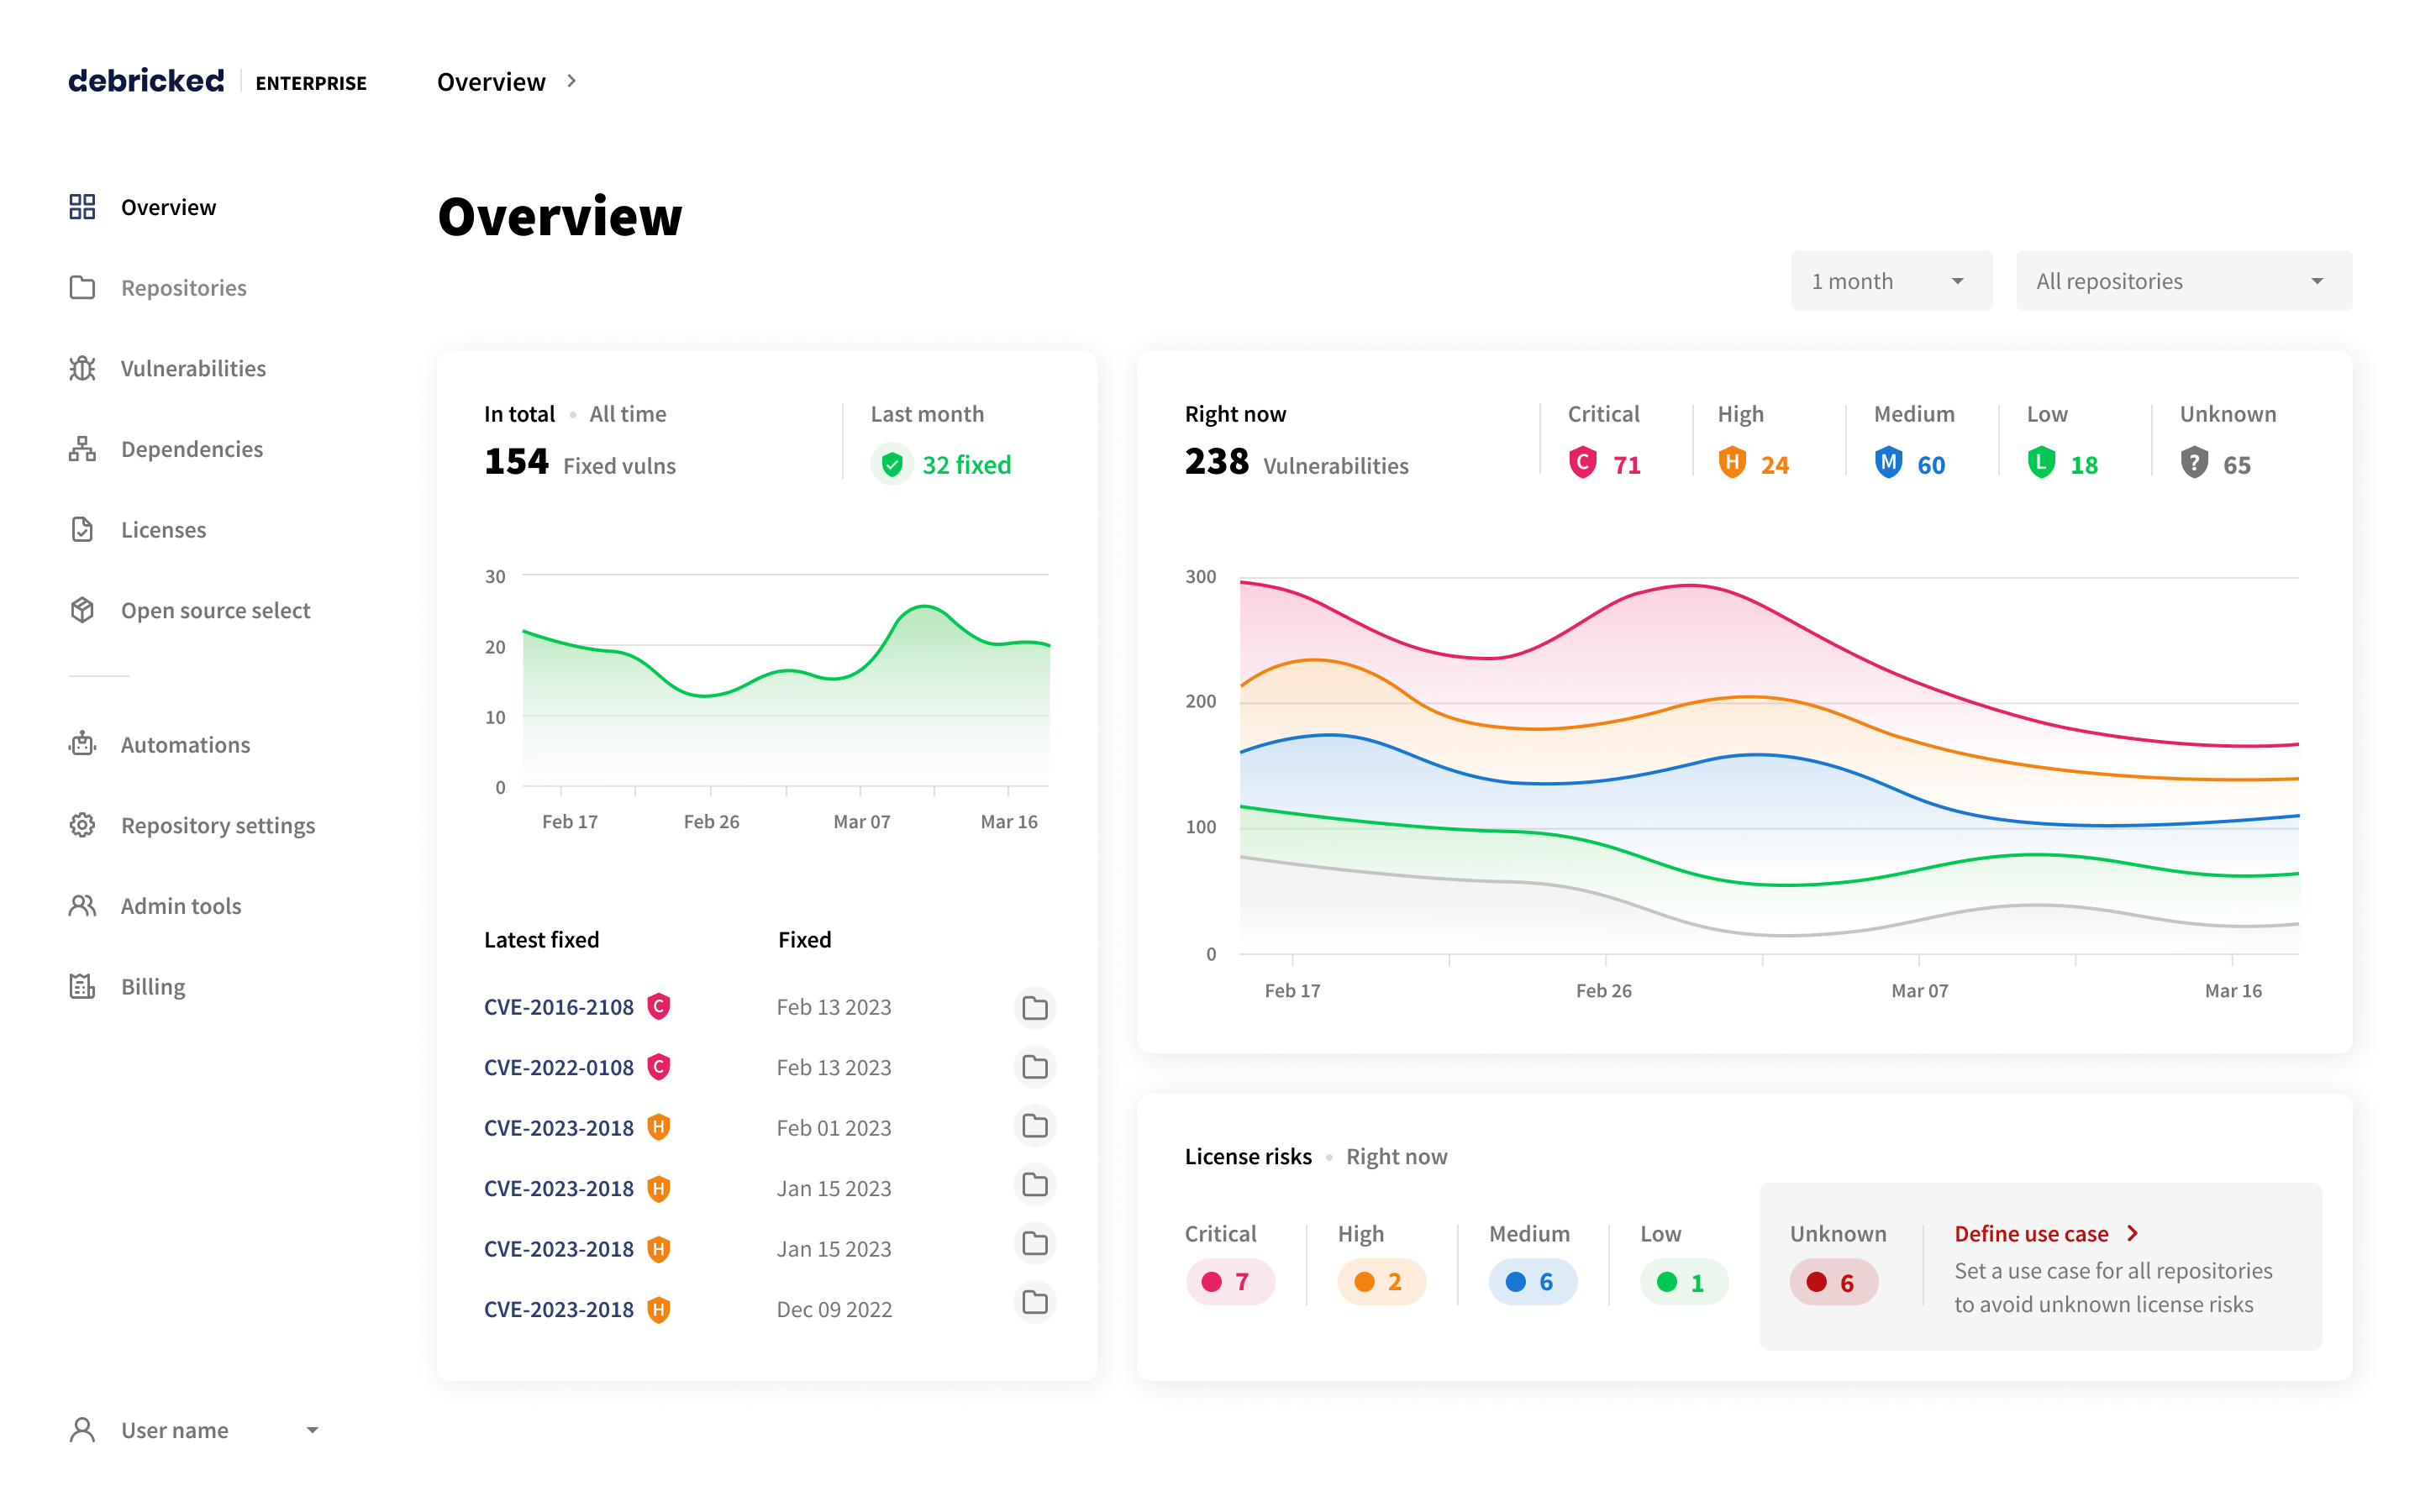
Clicking on Overview in the left side menu will take you to a dashboard allowing you to get a clear overview of all vulnerabilities found in your organization.
Filters
Repository/Branch
The data presented in the Overview can be filtered depending on your needs. The repository picker enables you to select either a specific repository/branch or all your repositories altogether. When an individual repository is selected a specific branch selector shows up to further narrow down your data. The All repositories view shows data from the sum of the default branches present in all repositories.
Keep in mind that due to limitations, we might not always be able to identify the default branch. For GitLab users, we should always be able to find your default branch, whereas for other users, we can only guarantee that we find your default branch if the branch name is either master or main. We will still make an effort to identify your default branch outside these cases correctly. This effort consists of looking for the branch with the most activity as it is assumed that, at least over time, this is the most interesting branch to look at.
Time period
You can select a time interval for the data to be shown: 1 week, 2 weeks, 1 month, 3 months, 6 months, and up to 12 months. The Debricked API allows you to freely select a custom interval, e.g. a number of days or over 12 months. Keep in mind that for the period prior to our first snapshot, the data will be padded with 0 values.
Widgets
Vulnerability Graph
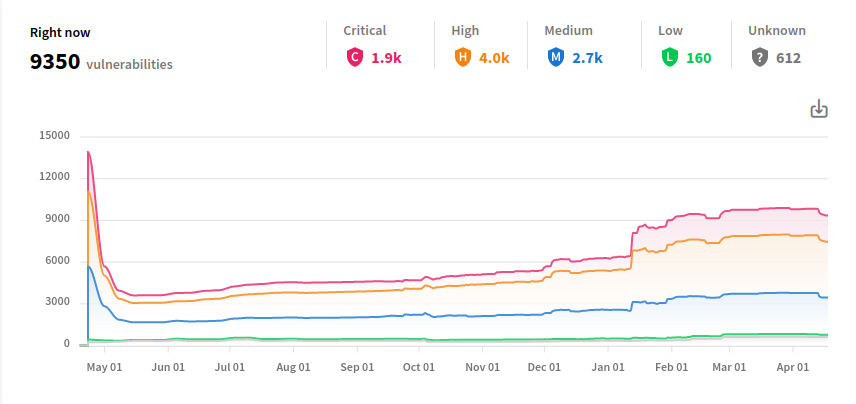
The main dashboard presents your organization’s historical data in the form of a graph. This view visualizes the total amount of vulnerabilities in selected repositories, grouped by severity. You can adjust the graph according to your needs, by changing the values in the repository/branch and time period pickers.
License Risk Widget
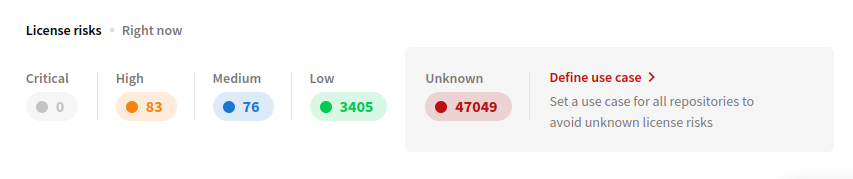
The bottom widget presents your current licence compliance risks, grouped by risk levels: critical, high, medium, low, and unknown. Keep in mind that this widget always shows you the current data, unaffected by the time period picker. You are still able to customize it by changing the selected repository/branch.
Fixed Vulnerabilities Widget
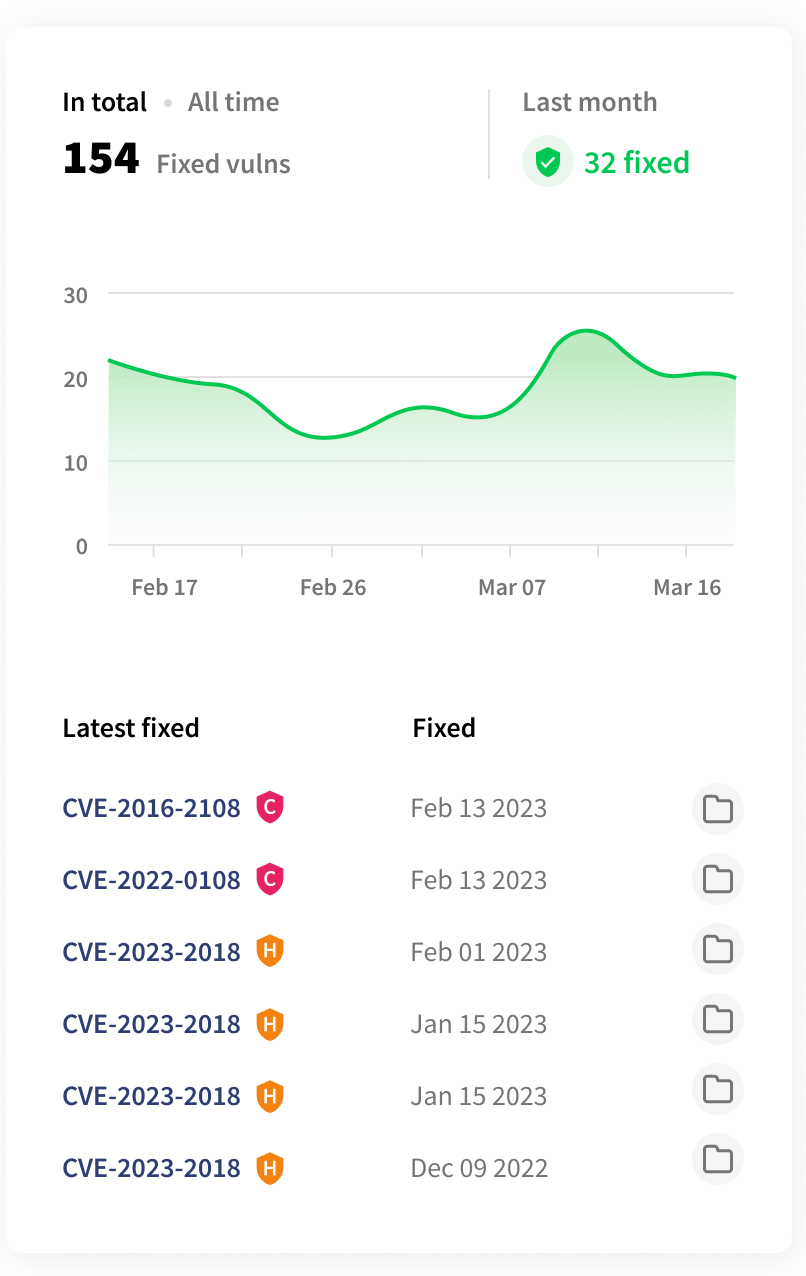
The left-side widget presents information about your recently fixed vulnerabilities, including:
the total amount of fixed vulnerabilities
- the amount of vulnerabilities fixed over the time period selected with the picker
- a graph visualizing your fixed vulnerabilities over a time period
- a sorted list of fixed vulnerabilities, the vulnerabilities fixed most recently shown at the top. Here you can also find their severity and the date they were fixed on. Clicking on the name of the vulnerability will take you the Vulnerability page, and clicking on the folder icon will open the repository where the vulnerability was found in.
You are also able to customize this widget by selecting the repository/branch and time period, using the filters.
Snapshots
In order to accurately represent data in the overview, we periodically save snapshots of the state of our users' repositories. These snapshots contain the number of unknown- , low- , high- , and critical-severity vulnerabilities in a given repository. This evaluation is based on CVSS scores, with CVSS3 always taking precedence over CVSS2. When a vulnerability does not have a CVSS score, it is assigned the unknown severity. The snapshots don’t record any other details about the vulnerabilities, only the quantity. They are created once per day and are updated upon each successful scan of a repository. Keep in mind that only snapshots coupled to the branch(es) being scanned will be updated.
Pruning
Note that in order to limit the amount of data that has to be stored, we periodically prune our snapshots. All Sunday snapshots are saved indefinitely, but the snapshots taken on other days are only retained for one month. That results in the resolution of the dashboard graph being drastically reduced for data older than one month.